Cadelis Rivergate Steady ground for your financial decisions
Sectors

One method,
tuned by industry

The five phases and the four scoring criteria never change. What changes is the weighting — the risks that matter most in mining are not the ones that keep a retailer up at night. Here's how we tune the model for each.


01 — By industry

What changes
for your sector

Every sector below runs the same audited method with a weighting profile built for its real exposures.

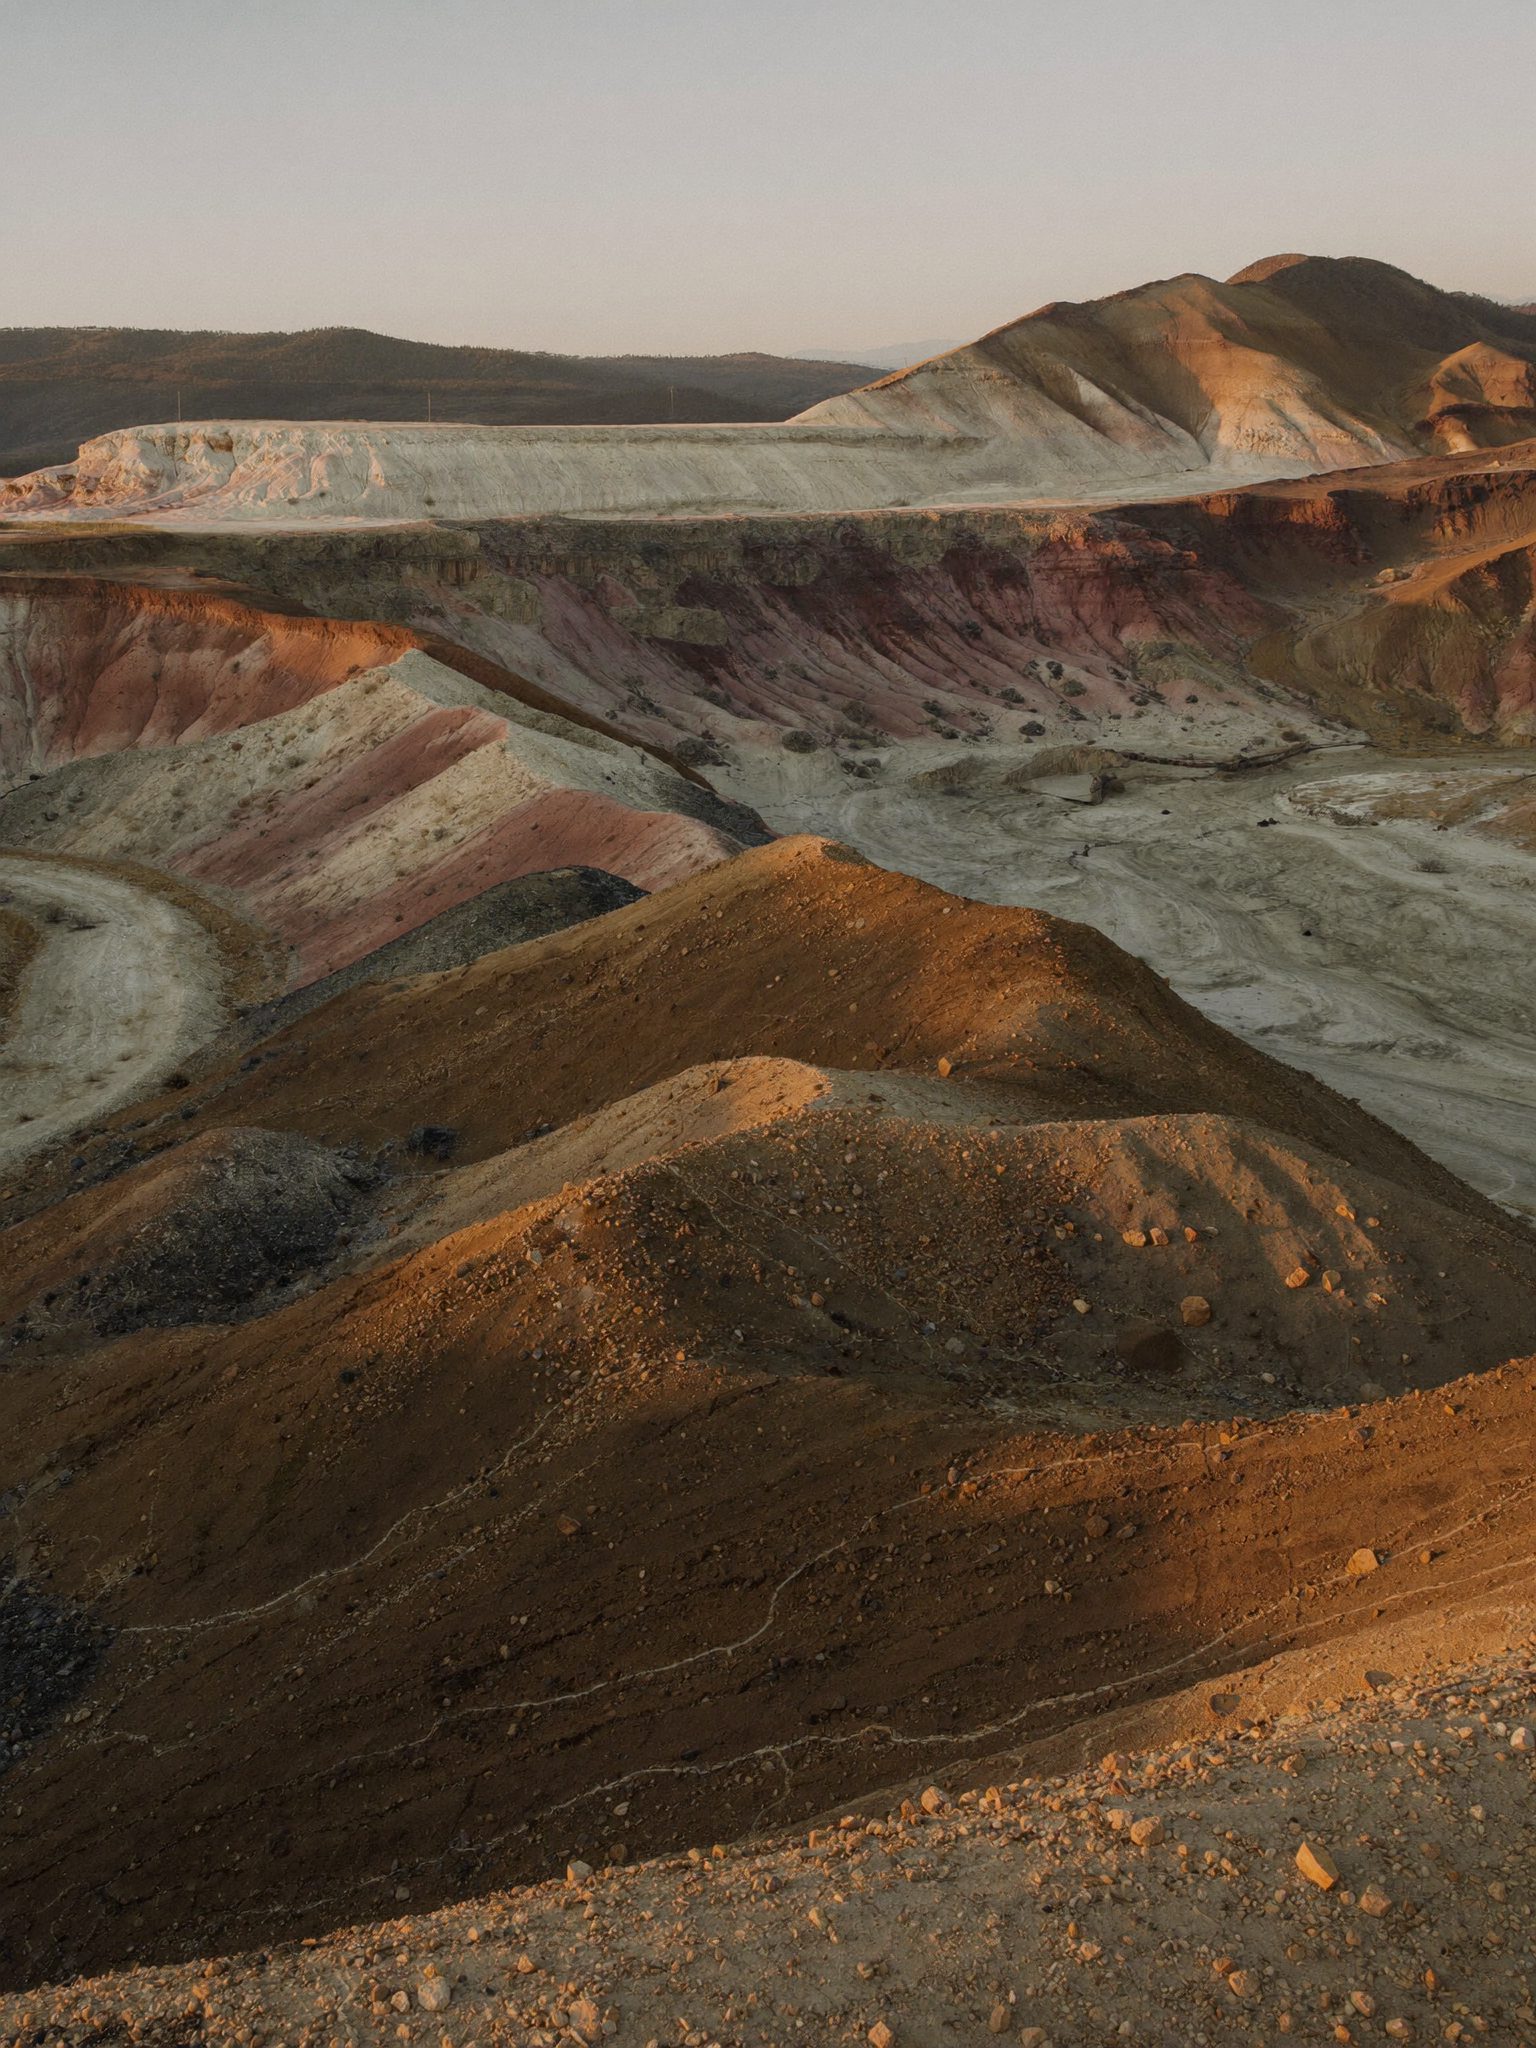
Mining escarpment landscape on the Highveld representing mining and extractives sector

Mining & extractives

Continuity and B-BBEE compliance weightings rise. We test supplier concentration against production-critical inputs and map single-source dependencies that can halt a plant. A stopped shaft costs more per day than most supplier contracts do in a year.
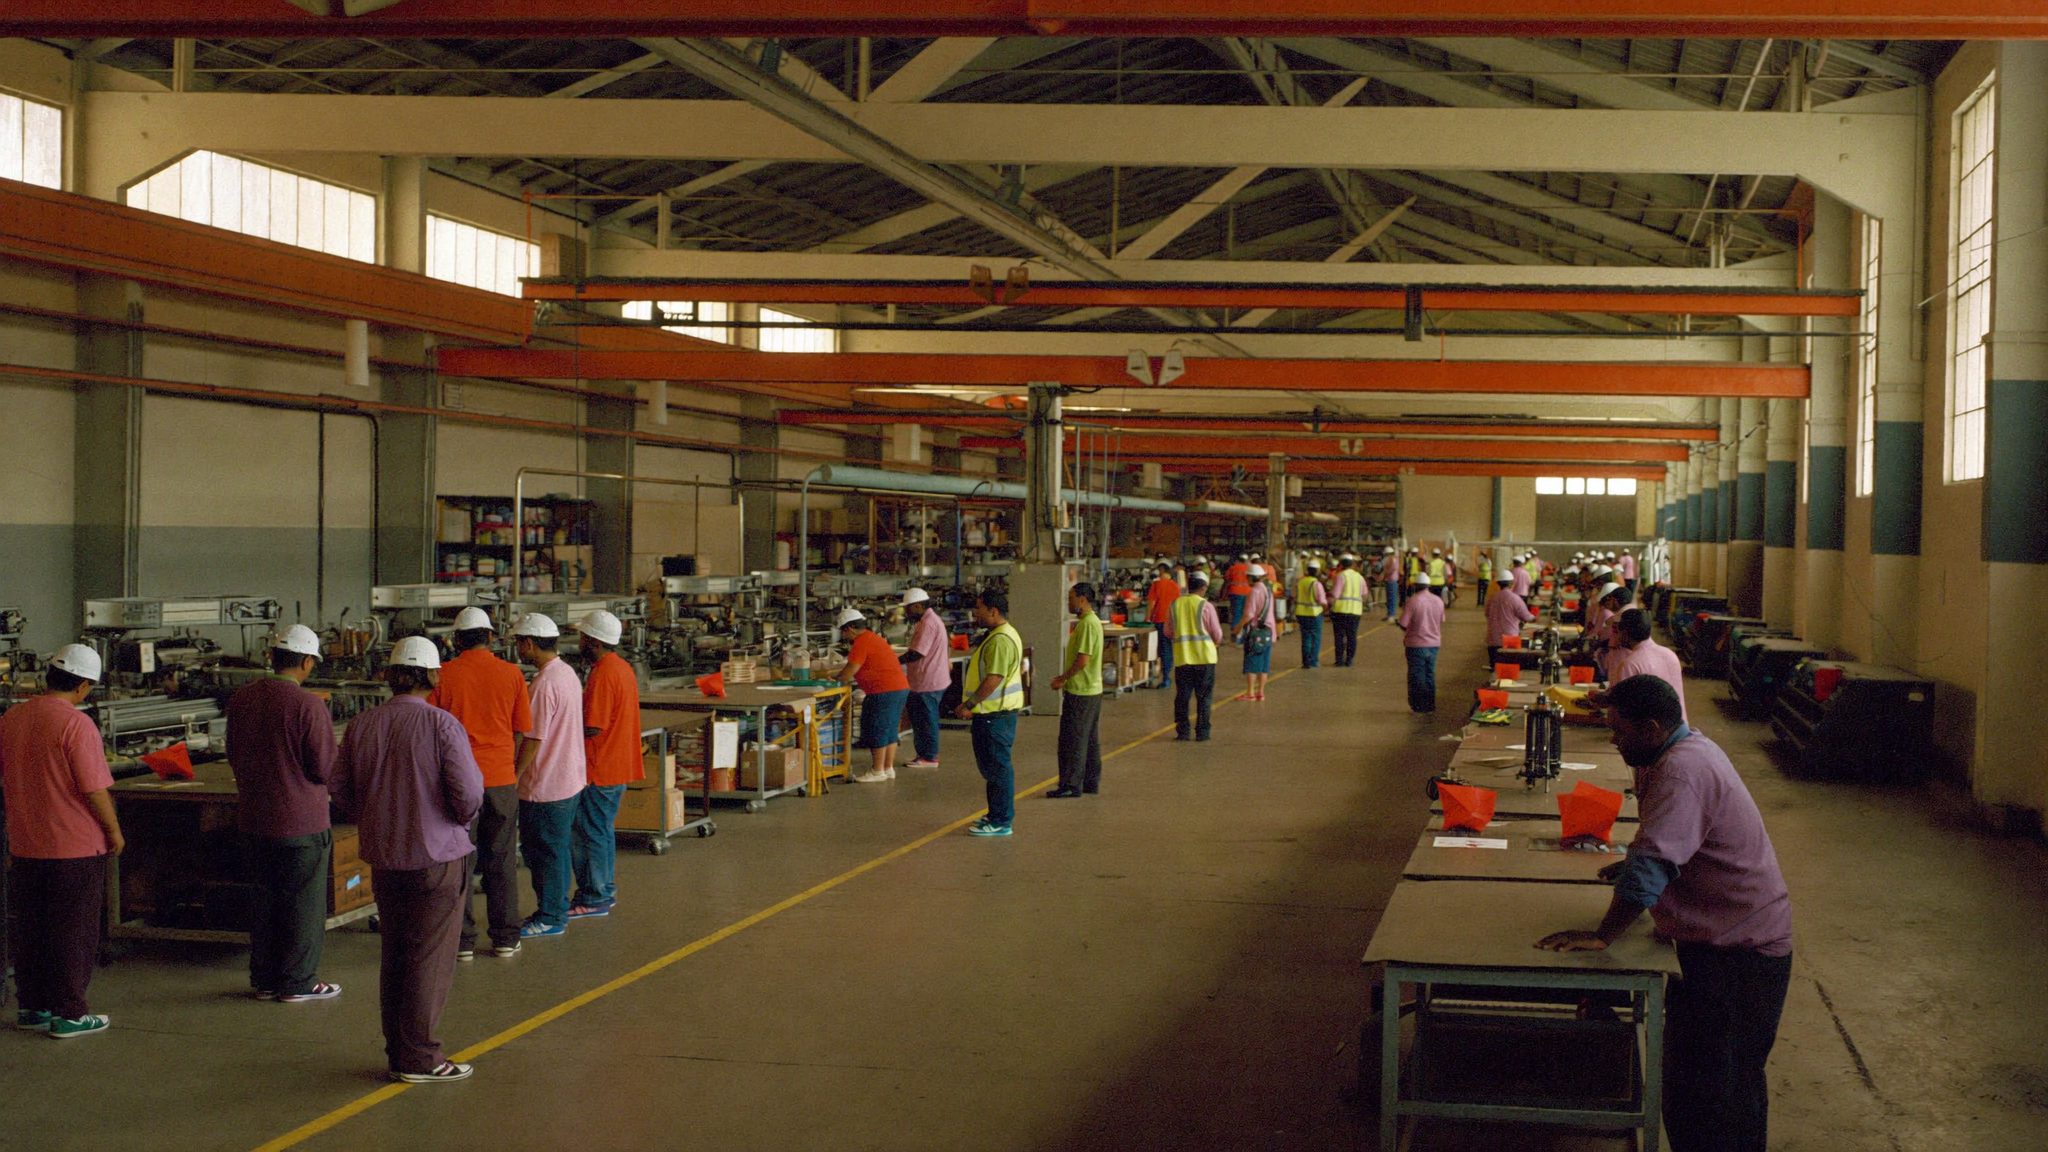
Manufacturing floor operations representing manufacturing and industrial sector

Manufacturing & industrial

We weight solvency of tier-one input suppliers and lead-time exposure most heavily, flagging any vendor whose failure would stop a line within a fortnight. Just-in-time efficiency and hidden fragility usually travel together.

Logistics & distribution

Fleet and fuel supplier concentration, cross-border VAT exposure and route-critical vendors carry the heaviest weightings. We separate the suppliers you could replace overnight from the ones your network depends on.

Agriculture & agri-processing

Seasonality and off-take counterparty risk lead the model. We stress-test payment terms against harvest cycles and grade weather-exposed suppliers separately, because a good year and a bad year are different risk pictures.

Public sector & SOEs

Procurement compliance and PFMA-aligned audit trails dominate. Every finding is documented to survive an external forensic review, because in this sector it very often will.

Retail & wholesale

The risk lives in the long tail of high-volume, low-value suppliers. We separate material vendors from noise so your buyers stop spending equal effort on the wrong four hundred accounts.


02 — In practice

From 600 unverified
suppliers to a defensible view

617 → 436 verified suppliers after the review

A Highveld industrial group carried 617 active suppliers and R412 million in annual spend with no reliable way to tell which vendors were registered, solvent or even trading. Over eleven weeks we verified every supplier above the R250,000 materiality line, retired 143 dormant or duplicate records, and found 38 that failed verification outright. The board received one scored register in place of 617 unverified rows, and top-five spend concentration fell from 61% to 44% over the following year. The audit finding that had run two years was closed at the next cycle.


Not sure how your
sector would score?

Tell us your industry and roughly how many suppliers you carry. We'll walk you through the weighting profile we'd use and what it would likely surface.